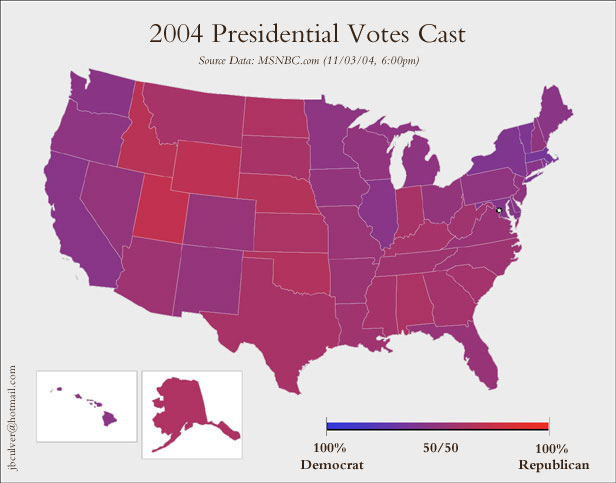
By now we've all seen the stark and striking red/blue division of the Electoral College map. No one is going to argue that there is a deep division in the electorate, but that particular presentation of the data is misleading in a number of ways:
- The red states are less densely populated. If you just glance at the map, it looks like Red America is predominant. The nice NYTimes interactive map has a feature to correct for that: you can click to resize the states according to the number of electoral votes they have. (Check also the "Previous Elections" feature of that map. A fantastic way to study history.)
- Since the electoral college is set up that way, naturally each state is colored red or blue depending on which candidate got more total votes in that state. For the EC, it only matters who got more votes--not by how much, and not where in the state they came from. The CNN map, for example, allows you to look at the results in each state county-by-county, which shows the finer geographical divisions of the electorate. And this map "deconstructs" the red/blue dichotomy.


No comments:
Post a Comment